This article has been reviewed according to Science X's editorial process and policies. Editors have highlighted the following attributes while ensuring the content's credibility:
fact-checked
peer-reviewed publication
trusted source
proofread
'Roving sentinels' discover new air pollution sources

In 2019, University of Utah atmospheric scientists, the Environmental Defense Fund and other partners added a new tool to their quiver of air quality monitors—two Google Street View cars, Salt Lake Valley's roving sentinels that would detect hyper-local air pollution hotspots.
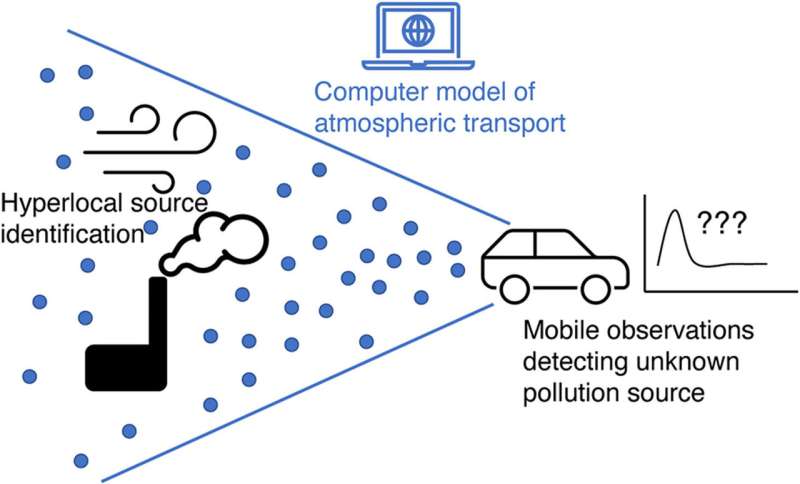
In the ensuing months John Lin, professor of atmospheric sciences at the U, developed a new modeling approach that used modeled wind-patterns and statistical analysis to trace pollution back to its source location to a scale previously missed by coarser scale monitoring projects that have traditionally characterized air quality averaged over an entire urban airshed.
The results are in a U- and Environmental Defense Fund (EFD)-led study that published in the October 2023 issue of the journal Atmospheric Environment.
"With mobile vehicles, you can literally send them anywhere that they could drive to map out pollution, including sources that are off the road that previous monitoring missed," said Lin, who also serves as associate director of the Wilkes Center for Climate Science & Policy. "I think the roving sentinel idea would be quite doable for a lot of cities."
The researchers loaded the vehicles with air quality instrumentation and directed drivers to trawl through neighborhoods street by street, taking one air sample per second to create a massive dataset of air pollutant concentrations in the Salt Lake Valley from May 2019 to March 2020. The observations yielded the highest-resolution map yet of pollution hotspots at fine scales—the data captured variability within 200 meters, or about two football fields.
"The big takeaway is that there is a lot of spatial variability of air pollution from one end of a block to another. There can be big differences in what people are breathing, and that scale is not captured by the typical regulatory monitors and the policy that the U.S. EPA uses to control air pollution," said Tammy Thompson, senior air quality scientist for EDF and co-author of the study.
Air quality patterns were as expected, with higher pollution around traffic and industrial areas. Pollutants were higher in neighborhoods with lower average incomes and a higher percentage of Black residents, confirming a well-known issue of environmental justice. This pattern traces its legacy to redlining policies from a century ago when the Homeowner's Loan Corp. created maps that outlined "hazardous" neighborhoods in red ink.
The redlined neighborhoods often had poor air quality due to industrial activities that existed alongside residents, who were often People of Color. Urban planners exacerbated the environmental issues by using the maps as justification to build highways and permit industrial companies in the so-called hazardous areas.
"Air quality is not a new issue. It's been around for decades and decades, and was probably much worse back then," said Lin. "The I-15 corridor follows these redlined neighborhoods. And sadly, there's a fair bit of research supporting the fact that redline neighborhoods, from 80 years ago, still matters. Those are in the neighborhoods still struggling with air quality problems. The legacy of racial discrimination is still there because they tend to be the under-invested neighborhoods."
A street-level view of air pollution
The research-grade instrumentation installed in the Google Street View cars measured ambient air pumped in from the surroundings and distinguished chemical signatures of key air pollutants, including nitrous oxides (NOx) emitted by automobiles, trucks, non-road vehicles and powerplants; black carbon (BC) from incomplete combustion from road and off-road diesel vehicles and industrial kilns; fine particulate matter (PM2.5) from dust or ash; and methane, primarily from the landfill.

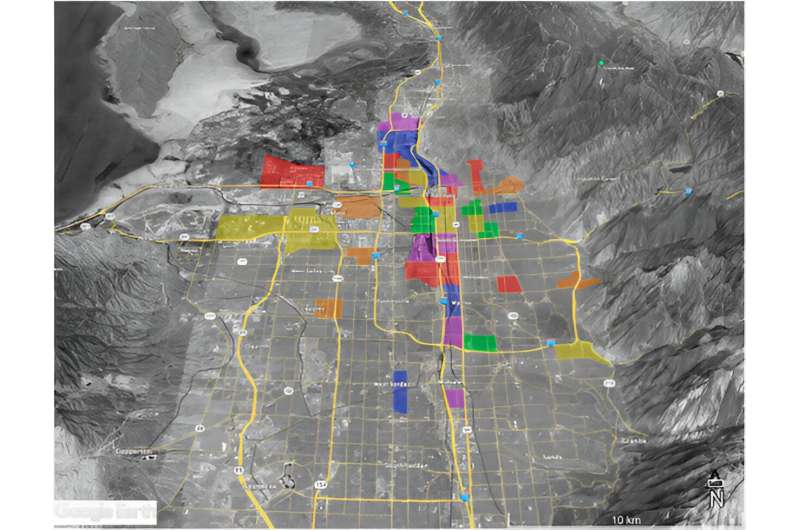
The researchers directed the drivers to sample air from 26 neighborhoods, from the industrialized areas of North Salt Lake to residential areas as south as Cottonwood Heights and West Jordan. The researchers chose neighborhoods that represented contrasting demographics across the valley, including in proportion of Black residents, average incomes ranging from 34K to 100K-plus, and areas dominated by industrial or residential buildings.
Most pollutants showed a strong pattern that reinforced what we already know—NOx, PM2.5, BC, and CO2 levels were elevated along highways in the valley. Areas with high levels of one pollutant were likely to be high in other pollutants, either from a single source emitting multiple pollutants or from overlapping sources.
"It's kind of boring to say, "Well, there's pollution on the roads." Everyone knows that. Right? So, we wanted to use the data to find the sources off the road," Lin said.
The authors tested Lin's new atmospheric modeling method with two case studies of well-known pollution sources—a large landfill methane source and a known gravel pit PM2.5 source.
They then applied the model to analyze a previous unknown area of elevated PM2.5, located in an industrial area just south of the Salt Lake City airport.
Next steps
The authors hope that other places will utilize the new method to identify pollution hotspots sources to make their cities safer, including identifying temporary sources, such as gas leaks, and permanent sources, such as industrial sources. Roving sentinels could help policymakers enact regulations and more effectively utilize resources to mitigate damage to their citizens.
The authors hope to utilize the atmospheric model for projects such as Air Tracker, a first-of-its-kind web-based tool that helps users find the likely source of air pollution in their neighborhoods.
Run on real-time, trusted scientific models and coupled with air pollution and weather data and developed in partnership with the U, EDF and the CREATE Lab at Carnegie Mellon University, Air Tracker helps users learn more about the air they're breathing, including pollution concentrations and its potential sources. Air Tracker is live in Salt Lake City Valley and will be rolled out to more locations across the country in the next couple of months.
"There are a lot of important environmental justice aspects to this work," said Thompson of the EDF. "We need to be able to understand what average air pollution looks like in different communities, and then understand why there is variability and why there are hotspots, and therefore what we can do about it. It's really, really important as we learn more and more about inequity in air pollution and what we're breathing across the country."
The research that published as "Towards hyperlocal source identification of pollutants in cities by combining mobile measurements with atmospheric modeling," utilized resources of the U's Center for High Performance Computing for computing the spatial distribution of pollution and developing the methodology for locating emission sources.
More information: John C. Lin et al, Towards hyperlocal source identification of pollutants in cities by combining mobile measurements with atmospheric modeling, Atmospheric Environment (2023). DOI: 10.1016/j.atmosenv.2023.119995
Journal information: Atmospheric Environment
Provided by University of Utah


